COMPUTER VISION / ML ENGINEERING
From image labels
to pixel-level models.
A computer vision workflow connecting data preparation, image classification and segmentation evaluation. My focus: the code that makes those stages work together.
THE PROBLEM
Useful vision models start
with the right training signal.
Image labels tell a model what is present. Segmentation asks where it is. The project explores how classifier activations can become pseudo-labels for training a foreground segmentation model.
The engineering task is to connect the data, models and evaluation into a workflow that can be inspected. A fully supervised route provides a reference for comparing the weaker training signal.
Classify the image
Separate pet from background
Task definitions from the source. Weak training uses pseudo-labels; validation and testing use ground-truth masks.
THE REPORTED RESULTS
Improve the training signal.
Measure what changes.
Three initialisations, baseline and refined pseudo-labels, and a fully supervised reference. The comparison shows the value of refinement and the remaining performance gap.
REPORTED EXPERIMENTS
Compare the training choices.
IMAGENET / REPORT TABLES 1 & 3
- Refined Grad-CAM mIoU
- 0.766
- Change from Grad-CAM
- +0.132 mIoU
- Full-supervision reference
- 0.869
Refinement improves the reported overlap. The fully supervised reference still scores higher, using pixel-level training labels.
Team project results from the supplied individual report, Tables 1 & 3. Values are reported scores; no training or evaluation was rerun for this page.
Read all scores and the metric definitions
Pixel accuracy counts correctly labelled pixels. mIoU measures region overlap. A large background region can make pixel accuracy look strong while foreground coverage is weaker.
The report uses IoU/mIoU labels. These values are reproduced as reported; raw run logs are unavailable to independently verify the aggregation. The current code’s two-class, batch-level definition is described in the source notes.
| Initialisation | Segmentation route | mIoU | Pixel accuracy | Table |
|---|---|---|---|---|
| Scratch | CAM | 0.546 | 74.3% | 1 |
| Scratch | Grad-CAM | 0.499 | 68.6% | 1 |
| Scratch | CAM + refinement | 0.589 | 75.6% | 3 |
| Scratch | Grad-CAM + refinement | 0.585 | 75.0% | 3 |
| Scratch | Full supervision | 0.788 | 89.3% | 1 |
| MoCoV2 | CAM | 0.570 | 74.2% | 1 |
| MoCoV2 | Grad-CAM | 0.556 | 74.0% | 1 |
| MoCoV2 | CAM + refinement | 0.598 | 79.8% | 3 |
| MoCoV2 | Grad-CAM + refinement | 0.622 | 81.2% | 3 |
| MoCoV2 | Full supervision | 0.836 | 91.5% | 1 |
| ImageNet | CAM | 0.589 | 77.6% | 1 |
| ImageNet | Grad-CAM | 0.634 | 80.3% | 1 |
| ImageNet | CAM + refinement | 0.744 | 86.6% | 3 |
| ImageNet | Grad-CAM + refinement | 0.766 | 87.8% | 3 |
| ImageNet | Full supervision | 0.869 | 93.2% | 1 |
Reported classifier accuracy: Scratch 41.5% · MoCoV2 65.9% · ImageNet 84.2%. This is a separate image-classification task.
Inspect the threshold experiment
One parameter changes the result.
Four reported thresholds with ImageNet initialisation. Grad-CAM reaches its highest listed score at 0.5; CAM reaches its highest listed score at 0.7.
Each marker is one table value. Connecting lines are visual guides between these four settings.
| Threshold | CAM mIoU | Grad-CAM mIoU |
|---|---|---|
| 0.1 | 0.561 | 0.588 |
| 0.3 | 0.586 | 0.628 |
| 0.5 | 0.589 | 0.634 |
| 0.7 | 0.604 | 0.605 |
VISUAL EVIDENCE
See what the training mask captures.
The report’s original images connect the method to a visible result. These examples use ImageNet initialisation throughout.
ONE REPORTED EXAMPLE / IMAGENET
Switch methods to inspect how the pseudo-label covers the pet.
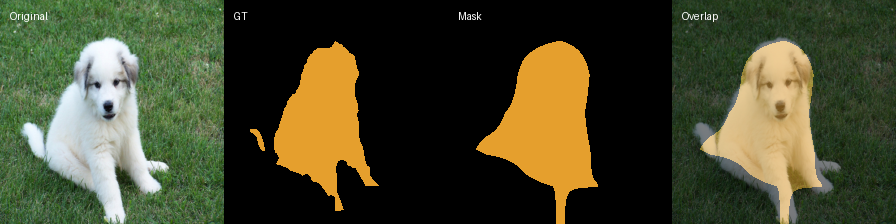
Original image
Pet photograph from the report
Reference mask
Ground-truth foreground
Generated pseudo-label
Grad-CAM + refinement
Pseudo-label overlay
Coverage on the original image
Original embedded figure, displayed as four panels. This report figure shows a pseudo-label used for segmentation training. One example cannot establish general performance.
Image data: Oxford-IIIT Pet, Parkhi et al. (2012) · CC BY-SA 4.0. Copyright remains with the original image owners. Figure pixels are unchanged; the panel layout is adapted for display.
THE ENGINEERING WORKFLOW
Trace the work from input to evaluation.
Select a stage to see its responsibility, the artifacts it passes on and the supporting implementation.
01 / MY CONTRIBUTION
Keep the image and its label aligned.
A shared dataset class serves classification, ground-truth segmentation and pseudo-mask training. The split utility stratifies the train/validation partition by breed; training image–mask pairs share crop and flip operations.
Images, breed labels and optional masks
Image tensors and the labels needed by each task
Implementation details
- Training and validation lists are separate from the test list.
- Image normalisation and spatial transforms are explicit.
- Pet, background and boundary trimap values are mapped to two segmentation classes.
Read the complete workflow
| Stage | Input | Output |
|---|---|---|
| Prepare data | Images, breed labels and optional masks | Image tensors and the labels needed by each task |
| Train classifier | Prepared images and breed labels | A classifier checkpoint selected by validation accuracy |
| Build pseudo-labels | Classifier activations or a class-agnostic model | Activation arrays and binary pseudo-mask files |
| Train segmentation | Images paired with pseudo-labels or ground-truth masks | A two-class PSPNet checkpoint |
| Evaluate outputs | A segmentation checkpoint and test images with reference masks | Metric JSON and optional prediction visualisations |
MY ROLE IN THE TEAM
Where I focused the engineering.
I primarily worked on the code: data processing, the classifier and the overall evaluation pipeline. The mask-generation and segmentation stages are shown as context for the team’s complete system.
Data that fits the task
Image loading, breed labels, foreground masks and paired transforms — connected through the dataset layer.
Inspect data handlingA configurable classifier
Model construction, training and validation checkpoint selection, with experiment settings carried through the workflow.
Inspect classifier trainingAn inspectable evaluation pipeline
Test-time predictions, explicit metric calculations and visualisation code for comparing predictions with reference masks.
Inspect model evaluationMETHODS & SOURCE
The detail behind the workflow.
Project scope and contribution
This is a group project on Oxford-IIIT Pet. My confirmed responsibilities are code implementation for data processing, classifiers and the overall evaluation pipeline. The full team pipeline also includes CAM-based pseudo-labels, class-agnostic refinement and PSPNet segmentation.
The project combines established model architectures and methods. ResNet, CAM, Grad-CAM, MoCo v2 and PSPNet are not presented as my original algorithms.
Training signals and evaluation boundaries
In weak mode, the segmentation training loader uses generated pseudo-masks. Validation and test evaluation use reference trimaps, mapping the pet label to foreground and both the background and boundary labels to background.
The split utility uses a seeded, per-breed 80:20 train/validation partition. Activation and class-agnostic stages can consume trainval images, so this is not a claim that every model is selected without exposure to those images. The held-out test split remains a distinct evaluation input.
The current repository metric is a sample-weighted average of batch-level two-class mIoU. The report uses IoU/mIoU labels; raw run logs are unavailable to independently confirm its aggregation. Displayed scores retain the report values and precision.
Reading the report alongside the code
Table values determine the displayed results. Table 1 gives CAM a higher IoU than Grad-CAM with Scratch and MoCoV2 initialisation, and Grad-CAM a higher IoU with ImageNet. The method comparison depends on the setting.
The report and current source differ in learning rate, early-stopping description, mask resolution and refinement thresholds. They are shown as related evidence, without claiming that the current checkout exactly reproduces every reported run.
The appendix figures show pseudo-labels. They illustrate mask coverage on one example; the aggregate model scores come from the separate result tables.
Source version and execution scope
This walkthrough follows commit ada679c79864. Report fingerprint: dd60ab4ecfe5. The code walkthrough follows the GitHub implementation. Results come from the supplied COMP0197 Individual Report: Tables 1–2 on page 5, Table 3 on page 6, and Figures 3–6 on page 8. The four figures are extracted directly from the PDF with identical pixel values; this viewer rearranges their panels for smaller screens.
No dataset, checkpoint, training or inference was run for this portfolio page. The source includes configuration and CLI inconsistencies; its clean execution has not been verified. A rebuild would first reconcile the experiment settings and checkpoint paths, then verify the image–mask transforms and evaluation definitions.
Inspect CLI orchestration ↗Inspect the metric definitions ↗APPLIED ML & STATISTICAL MODELLING
Have an image-based problem to solve?
Start with the task, the images available and how a useful prediction should be evaluated.